Cellulose
.........................................................................................
Introduction
Such photosynthetic organisms as plants, algae, and some bacteria produce more than 180 billion tones of organic matter each year from the fixation of carbon dioxide. Half of this biomass is made up of the biopolymer cellulose, which is thus the most abundant organic molecule on the planet. This carbohydrate macromolecule is the principal structural component of the cell wall of most plants. Cellulose is also a major component of wood, as well as of cotton and other textile fibers such as linen, hemp, and jute (ramie).
Tissues of such higher plants as trees, cotton, flax, sugar beet residues, ramie, cereal straw, and the like constitute the main sources of cellulose. The name cellulose, as coined by Anselme Payen

in 1838, indicates that it is the sugar (the ‘ose’) from cells. This sugar (the ‘glucose unit’) is the repeating unit of a long polymeric chain. Cellulose is also found in prokaryotic organisms (
Acetobacter xylinum,
Agrobacterium tumefaciens,
Rhizobium spp.,
Escherichia coli,
Klebsiella pneumoniae,
Salmonella typhimurium,
Sarcina ventriculi and also eukaryotes (
Fig. 1), including certain animals (tunicates), algae, fungi, such vascular plants as mosses and ferns, gymnosperms, and angiosperms
, and the cellular slime mold
Dictyostelium discoideum. Proof of cellulose biosynthesis in cyanobacteria, which were probably among the earliest forms of life on earth, has also been demonstrated
.
Cellulose is also synthesized by such bacteria as
Acetobacter. It is also found in a highly crystalline form in the cell walls of such algae as
Valonia and
Microdicyon. The animal kingdom also provides examples of several types of cellulose, the best studied of which is the membrane of marine animals belonging to the
Ascite family, commonly termed tunicates
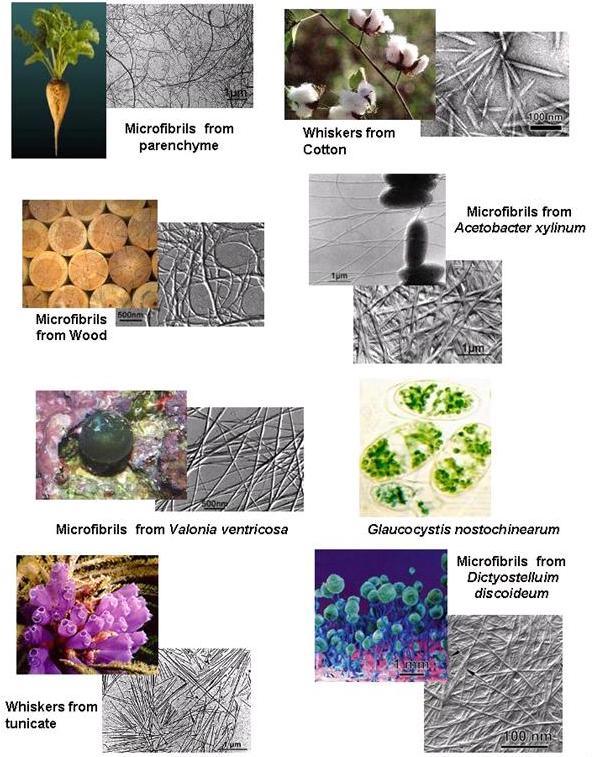
Fig. 1 The ubiquitous occurence of cellulose in Nature
With about 1011 tons of cellulose growing and disappearing annually, cellulose is the most abundant renewable organic material on earth. In such plant sources as the wood of mature trees, the content of cellulose is in the order of 35–50%. The secondary walls of cotton fibers are almost pure (94%) cellulose. Throughout their lifetime, the cells of living plants continue to divide with the production of certain cells having the unusual property of being able to grow indefinitely while retaining the quality of young plants. These meristematic cells and those deriving from them grow and then differentiate into specialized cells for various functions, such as support, protection, flow of sap, and others. A collection of cells specialized for a single function constitutes a tissue.
Plant cell walls are distinguished from animal cells by the presence, around the plasmalemma, of a wall within which complex physicochemical and enzymatic phenomena take place. In the course of cell growth, the dimensions of the cell wall vary according to the types of macromolecules of which it is composed. The first wall deposited after cell division is called the “middle lamella” and is composed essentially of pectic material. The cell then lays down a wall composed of pecto-cellulosic material to supplant the middle lamella of the "primary" cell wall.
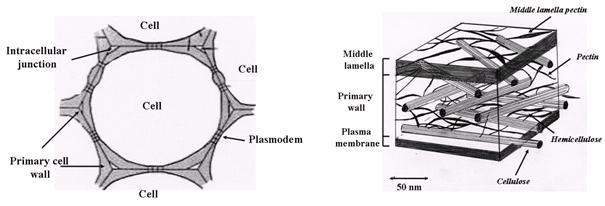
Fig. 2 Schematic representation of the plant cell wall, and the location of the main polysaccharide components
The primary cell wall is actually a glycoproteinaceous layer composed of pectin, cellulose, hemicellulose, and proteins. As the cell ages and differentiates, it secretes new materials, which form a mixture with the constituents of the primary cell wall and thereby so leads to the formation of a "secondary" cell wall. The nature of the constituents of the secondary cell wall depends on the cell type and the tissue to which the cell belongs. In general, totally differentiated cells cease expanding and cannot divide further.
Young plant cell walls feature a structure that is simultaneously rigid and dynamic. Indeed, rigidity is required to counterbalance the effect of turgor pressure on the plasmalemma. To allow cell extension to occur the cell wall structure must be deformable. This dual functionality of cell walls is achieved through the mixture of polysaccharides and proteins. Cellulose chains are formed into microfibrils that constitute the basic framework of the cell, conveying a great resistance to tensile forces .
The historical term microfibril can be a source of confusion, as it has been used by different authors along with closely related terms such as “protofibril”, elementary fibril”, and “nano-fibers”, As pointed out by Nishiyama, the term “cellulose microfibril” addresses features that are not limited to its size. For this reason, it is used throughout this article.* The cellulose microfibrils comprise about 20–30% of dry weight cell wall material, occupying about 15% of cell wall volume. In cell walls that have differentiated and have synthesized a secondary cell, the proportion of cellulose reaches 40–90% of the wall biomass .
___________________________________________________________________________
*The historical term microfibril can be a source of confusion as it has been used by different authors along with closely related terms such as “protofibril,” “elementary fibril,” and “nano-fibers.” As pointed out by Nishiyama, the term “cellulose microfibril” addresses features that are not limited to its size. For this reason, it is used throughout this article.
___________________________________________________________________________
The orientation and disposition of microfibrils in the wall is important, since they more or less control the capacity of the wall to deform and the direction in which the deformation can occur. In the final stages of cell wall differentiation, notably in the middle lamella and primary cell wall, other wall polymers ("lignins") are incorporated into the spaces around the polysaccharide fibrillar components to form lignin--polysaccharides. The hemicelluloses constitute a large number of different polysaccharide molecules, which actually form a matrix for the cellulose microfibrils engaged in such molecular interactions as hydrogen bonds and van der Waals’ forces. Pectins constitute a major component of dicotyledonous higher plants, about 35% of the cell wall dry weight. The plant cell wall contains range of proteins, which are implicated in the organization and metabolism of the cell wall.
Available evidence suggests that cellulose is formed at, or outside the plasma membrane. Groups of rosette particles or terminal complexes are seen in the plasma membrane. These groups of rosettes particles can be seen to be associated with the ends of microfibrils (collections of cellulose chains) and are thought to be Cellulose Synthase Complexes, involved in the elongation of whole cellulose microfibrils. The catalytic subunit is a transmembrane protein having a trans-membrane region. A general model has been set up to explain the molecular organization of the cellulose synthase molecules from the molecular level of organization to the level of the rosette terminal complex . Current estimates of the diameter of the Cellulose Synthase Complex on the endoplasmic region of the plasma membranes are in the range of 40–60 nm; which makes it one of the largest protein complexes thus far observed. This complex is responsible for the synthesis of a microfribril which has 36 cellulose chains. Each of the six subunits of the rosette must consist of six glucan synthase molecules. The life-time of the Cellulose Synthase Complex is estimated to be in the order of 30 minutes, the velocity is in the range of 300 nm/min . The rates of movement correspond to the addition of about 300 to 1000 glucose per glucan chain per minute.
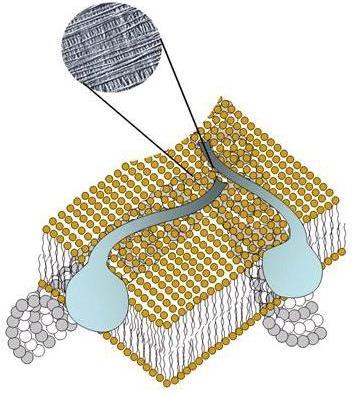
Fig. 3 Cartoon representation of a cellulose synthase complex moving inside the plasma membrane, leaving a cellulose microfibril as one component of the primary cell wall (inset: transmission electron microscopy). The cellulose synthase complex becomes active while unattached to a microtubule
Conformations and Crystalline Structures of Cellulose
1. Chemical structure of the Cellulose Macromolecule
Even though the early work of Braconnot concerning the acid hydrolysis of the substance constituting plant cell walls goes back to the 19th century , it is with Anselme Payen that the honor lies of establishing the fact that the fibrous component of all plant cells has a unique chemical structure . It is also from the studies of Payen that the word cellulose was first coined . An extended presentation of the history of the cellulose can be found in .
The primary structure of cellulose as a linear hompolymer of glucose residues having the D-configuration and connected by β-(1→4) glycosidic linkages (Fig. 4). The two chain ends are chemically different. One end has a D-glucopyranosyl group in which the anomeric carbon atom is involved in a glycosidic linkage whereas the other end has a D-glucopyranose residue in which the anomeric carbon atom is free. This latter cyclic hemiacetal function is in an α,β anomeric equilibrium via a small proportion of the free aldehyde form: this gives rise to the observed properties at this end of the chain. Determination of the relative orientation of cellulose chains in the three-dimensional structure has been one of the major problems in the study of cellulose.
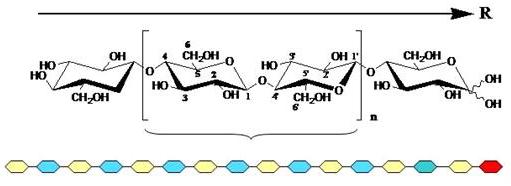
Fig. 4 Molecular representation of the chain structure of cellulose. Labeling of the cellobiose repeat unit is given in accordance with IUPAC nomenclature, n indicates the number of repeating disaccharide units in a given cellulose chain. The reducing end of the chain is indicated, a schematic representation of the chemical polarity of the chain is shown underneath
The degree of polymerization (DP) of native celluloses depends on the source, and is not well established. Indeed, the combination of procedures required to isolate, purify, and solubilize cellulose generally causes scission of the chains. The DP values obtained are therefore minimal and depend on the methods used . Values of DP ranging from hundreds to several tens of thousands have been reported . For the same reasons the distribution of chain lengths of cellulose is not well established. Nonetheless, some authors suggest that the molecular-mass distribution must be homogeneous for a cellulose of a given source .
X-Ray diffraction patterns obtained from fibrillar samples do not provide sufficient experimental information to resolve the crystallographic structure unambiguously. Indeed a fiber is composed of an assembly of crystallites having a common axis, but random orientation. Added to this source of disorder, there is also that arising from the disorientation of the chains in the interior of the crystallite domains, as well as their small dimensions. These various sources of disorder are the origin of the low number of reflections found in the fiber diagrams. On these diffractograms the reflections are distributed in horizontal rows, the spacing of which corresponds to the fiber repeat when the polymer axis is parallel to the fiber axis (Fig. 5). Thus this periodicity is a geometric parameter that can be determined unambiguously from a fiber diagram, and this usually corresponds to the c dimension of the unit cell. Systematic absences of (0, 0, 1) reflections also provide information about the helical symmetry of the polymer chain. The possibility of unambiguous determination of the other unit-cell parameters, as well as systematic absences in all the reciprocal space, depends on the ability to index the observed reflections, and this in turn, depends on the quality of the samples.
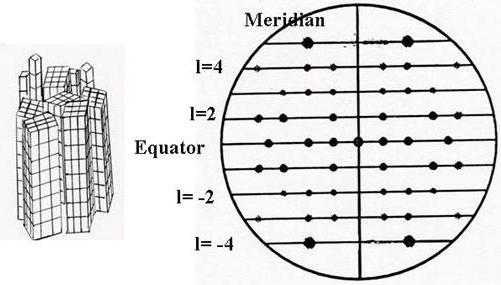
Fig. 5 Idealized fiber diffractogram from X-ray or neutron scattering. An assembly of partially ordered blocks of micro-crystallites diffracts to produce diffraction spots that are recorded on a flat film or an area detector. The periodicity of the macromolecular constituents within the micro-crystallites is indicated by a series of diffracting lines having a regular spacing. The equator corresponds to the layer line 0, intersecting the non-diffracted central beam. The meridian is perpendicular to the equator and it lies parallel to the fiber axis. The spacing along the meridian provides information about the periodicity of the macromolecule and its helical symmetry. The so-called helical parameters, n and h, are directly related to the symmetry of the macromolecular chain: n is the number if residues per turn, and h the projection of the residue on the helical axis.
The conformation of the cellulose chain can be determined by means of molecular modeling, taking into account such experimental data as the helical parameters derived from the X-ray fiber-diffraction diagrams. In the case of the cellulose chain, the conformational variations depend principally on the rotations around the glycosidic linkage. The first step involves construction of a map of the energies corresponding to the variations of the angles (φ, ψ) that make up the glycosidic linkage. In the same way, it is possible to superimpose values of helical parameters on the iso-energy maps and permit the construction of a stable model.
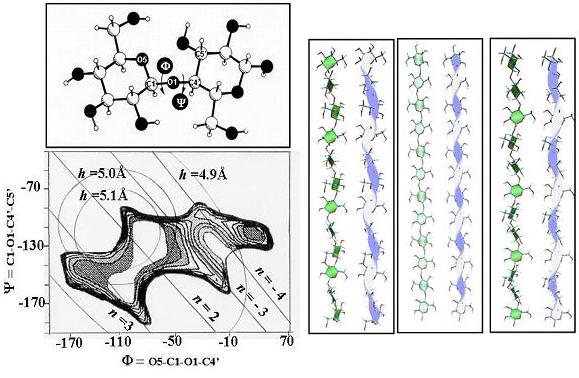
Fig. 6 Selected helical parameters n, h, computed for a regular cellulose chain as a function of glycosidic torsion angles phi and psi. The iso-n and iso-h contours are superimposed on the potential-energy surface for cellobiose. Arbitrarily, positive values of n and h designate a right-handed helix, and opposite signs correspond to left-handed chirality. The screw sense of the helix changes to the opposite sign whenever the values n = 2 are interchanged. In practice the regular parameters are readily derived from the observed fiber-diffraction pattern (n = 2, h = 5.18 Å ). Values of the torsional angles consistent with the observed parameters are found at the intersection of the corresponding iso-h and iso-n contours. Discrimination between possible solutions is based on the magnitude of the potential energy. The 3-D representations of a cellulose chain having respectively a right-handed 3-fold, a 2 fold and a left-handed 3-fold helical symmetry are shown.
The representation of the three-dimensional structure of the cellulose chain shows some key structural characteristics. As a consequence of the 4C1 chair conformation and the (1→4) glycosidic linkage of the β-D-glucopyranose residues, the structure is much extended and corresponds to a two-fold helix having a periodicity of 10.36 Å, which corresponds to the lowest energy conformation.
This conformation is situated in the low-energy zone in which van der Waals interaction and the anomeric effect are optimized. An intramolecular hydrogen-bond between O-3 and the ring O-5 of another residue provides additional stabilization (O-5....O-3: 2.75 Å). This linkage is standard in cellulose chains with two-fold symmetry, but is absent when other less-stable conformations are adopted under different external environments. Other conformations generating such helical conformations having three-fold symmetry can also occur. The exocyclic primary hydroxyl groups (O-6) can adopt three low-energy conformations [gauche–gauche (gg), gauche–trans(gt), and trans–-gauche (tg)] as a consequence of a gauche stereoelectronic effect .
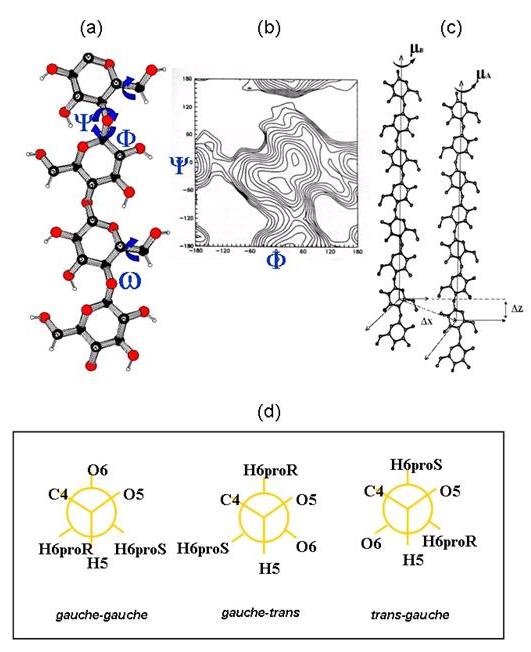
Fig. 7 Structural descriptors for the cellulose conformation and 3-D structure.
(a) The main conformational descriptors of the cellulose chains are the glycosidic torsional angles Φ = O-5---C-5—C-1—O-1, Ψ = C-5–C-1–O-1–C-4’, and the orientation of the primary hydroxyl group about the C-5-C-6 bond: ω.
(b) The low energy conformations of the chains are derived from the potential energy surface that shows conformational energy with respect to the Φ and Ψ torsion angles
(c) The relative orientation of two cellulose chains is dictated by the interhelical parameters µA, µB : rotation of chains A and B; ΔZ : translation of chain B with respect to chain A; ΔX : distance between the helical axis of chains A and B.
(d) The primary hydroxyl group of a pyranose is locked to the C-6 carbon atom, whereas the secondary hydroxyl groups are linked to the ring carbon atoms. The orientation of the primary hydroxyl group is referred to two different torsion angles. The first is O-5—C-5—C-6—O-6 and the second is C-4—C-5—C-6—O-6. These torsion angles are said to be in a gauche conformation when they have a ±60° angle; and in a trans conformation at 180°. The 3 significant conformations are thus: gauche–gauche (gg), gauche–trans (gt) and trans–gauche. Usually, one of the three possible conformers, gg, gt, tg is discarded because of the unfavorable 1-3-syn-axial interactions between the O-6 and O-4 atoms. The prochiral hydrogen atoms (as proR and proS) are noted .
Although the trans–gauche orientation is rarely observed in the crystalline structures of oligosaccharides this conformation would yield a second hydrogen bond between chains (O-2-H....O-6 = 2.87 Å) that brings an extra stabilizing factor to the chain conformation of cellulose. Nevertheless it should be mentioned that cellulose can adopt other low-energy conformations, in particular at the interface of crystalline and amorphous zones where stacking constraints are weaker. Obviously, the possibilities for the formation of intra- and inter-chain hydrogen bonds can give rise to various possibilities for the formation of stable three-dimensional structures. These possibilities are also reflected in differences of reactivity of the different functional groups, in particular in etherification reactions, since it has been shown that the O-3 and O-6 hydroxyl groups are much less reactive than O-2.
2. Crystallinity and Polymorphism of Cellulose
The free hydroxyl groups present in the cellulose macromolecule can be involved in a number of intra- and inter-molecular hydrogen bonds, and consequently give rise to various ordered crystalline arrangements. These crystalline arrangements in the case of cellulose are usually imperfect to the extent that, in terms of crystal dimensions, even the chain orientation and the purity of the crystalline form must be taken into consideration. The crystal density can be gauged from the crystallographic data, as can the importance of the amorphous components generally present. The density of the crystalline phase is 1.59 g cm-3 but, when determined for natural samples, is of the order of 1.55 g cm -3 which corresponds to a value of ~ 70% for the crystalline component . The degree of crystallinity can also be estimated by infrared spectroscopy as a function of the relative intensity of certain bands . Four principal allomorphs have been identified for cellulose: I, II, III, and IV. Each of these forms can be identified by its characteristic X-ray diffraction pattern. Progress achieved in characterization of the ultrastructure of cellulose has shown that subgroups exist within these four allomorphic families. The relationships among the various allomorphs are shown schematically.
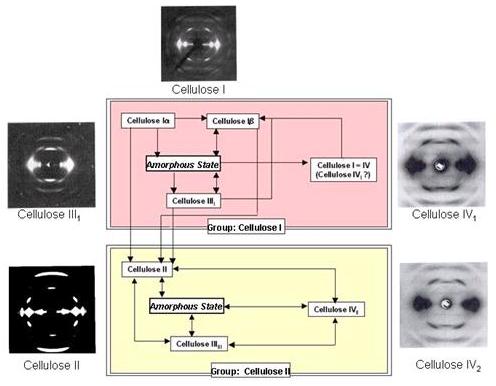
Fig. 8 Relationships among the different cellulose allomorphs, together with some prototypical fiber diffractograms.
The natural form of cellulose, termed cellulose I or native cellulose, is apparently the most abundant form. Its three-dimensional structure is highly complex and may comprise two distinct crystalline forms, cellulose Ia and Ib. Cellulose I can be made to undergo an irreversible transition to a stable crystalline form, cellulose II, by two distinct processes: regeneration and mercerization. The cellulose II allomorph is known by the term "regenerated" cellulose. Regeneration involves either preparing a solution of cellulose in an appropriate solvent or of an intermediate derivative followed by coagulation and recrystallization. This process is used to produce rayon fibers. Mercerization involves intra-crystalline swelling of cellulose in concentrated aqueous NaOH, followed by washing and recrystallization. This process is used to improve the properties of natural yarns and fabrics. The transition from cellulose I to cellulose II is not reversible, and this implies that cellulose II is a stable form as compared with the metastable cellulose I.
Treatment with liquid ammonia or with certain amines such as 1,2-diaminoethane (ethylenediamine, EDA) allows the preparation of cellulose III from either cellulose I (which leads to the form cellulose III1) or from cellulose II (which leads to the form III2). Cellulose III treated at high temperature in glycerol, is tranformed into cellulose IV. Here again two types exist: cellulose IV1 and IV2, respectively, obtained from cellulose III1 and III2. It is generally accepted that cellulose IV1 is a disordered form of cellulose I. This could explain the reported occurrence of this form in the native state in some plants, as determined by X-ray diffraction .
3. Crystalline Structures of Native Celluloses
X-Ray investigations of native cellulose samples were made in the 1990s following early observations by optical microscopy that suggested the existence of submicroscopic birefringent and oriented domains . The analysis of X-ray diffraction patterns has played and continues to play a major role in structural studies of cellulose . Prior to discovery of the crystalline dimorphism of cellulose, most crystallographic studies focused on determination of a basic unit cell. The controversy concerning the cellulose I unit-cell dimensions and space group (considered to be unique), has persisted for many years, in spite of observations by various workers , who reported experimental data showing that diffraction intensities and spacings varied greatly according to the origin of the sample. For this reason the literature is especially confusing on these points, and is overloaded with conflicting experimental data and structural models.
a. Cellulose I. --- From the X-ray diffraction pattern of cellulose from ramie, Meyer et al. proposed a monoclinic unit cell [a = 8.35 Å, b = 7.0 Å, and c = 10.3 Å (fiber axis), γ = 84°] which for a long time served as a point of reference. The symmetry elements in the space group P21 are compatible with a two-fold helicoidal symmetry for the cellulose chain, and the authors proposed a structural model in which the chains are oriented in antiparallel fashion. Later, more-elaborate studies that took advantage of methods for resolving crystal structures and taking the packing energies into account, showed that the original proposal of Meyer and Misch constitutes only an approximation . However, the principal modification to the original proposal concerned the chain orientation, which was concluded to be parallel in the crystalline lattice , .
Studies on highly crystalline algal cellulose led to a re-opening of the question of the unit cell and space group proposed by Meyer and Misch . In particular, electron-diffraction studies, made at low temperature on Valonia cellulose, produced results that were incompatible with both the unit-cell dimensions and the space-group symmetry proposed previously. The results, confirmed by independent studies, contradicted the two-fold symmetry of the chain, and suggested that Valonia cellulose had the space group P1 and a triclinic unit cell , .
b. Celluloses Iα and Iβ. --- Away from the main controversy, other work suggested that celluloses from Valonia and bacterial sources had the same crystalline unit cell. Native celluloses of different origins might, in the same way, crystallize in different arrangements with different dimensions , . It was ten more years before the existence of two families of native cellulose was confirmed by the application of solid-state NMR (13C CP/MAS) to a range of cellulose samples of different origins. From a detailed analysis of the carbon atom couplings observed in the solid state NMR spectrum, Vanderhaart and Atalla , established that native cellulose was a composite of two distinct crystalline phases, named Iα and Iβ.
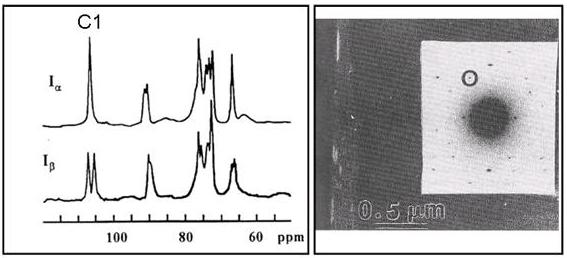
Fig. 9 Solid-state NMR spectrum of cellulose Ia and Ib, together with transmission electron microscopic evidence of the simultaneous occurrence of these two allomorphs within the same microfibril
The crystalline phases Iα and Iβ can occur in variable proportions according to the source of the cellulose. The celluloses produced by primitive organisms (bacteria, algae, and the like) are enriched in the Iα phase, whereas the cellulose of higher plants (for instance woody tissues, cotton, and ramie) consists mainly of the Iβ phase. Study of the cellulose of the outer membrane of marine animals showed that this is uniquely composed of the Iβ phase. Hence, this cellulose may be considered to be the standard for the Ib phase . Cellulose from Glaucocystis has been shown to consist of essentially cellulose Iα . The discovery of the crystalline dimorphism of cellulose was the starting point for a number of research projects the aim of which was to evaluate the properties of each allomorph and procedures for their interconversion , , , , . The observed reflections could be indexed to a monoclinic unit cell having space group P21 and dimensions a = 8.01 Å, b = 8.17 Å, c = 10.36 Å, γ = 97.3º. This unit cell is close to that proposed originally by Meyer and Misch from their work on cellulose from ramie, now known to be enriched in phase Iβ . Phase Iα corresponds to a triclinic symmetry with space group P1 and dimensions a = 6.74 Å, b = 5.93 Å, c = 10.36Å, α= 117º, β = 113º and γ = 97.3º.
The discovery of the crystalline dimorphism of cellulose and the existence of two families of native cellulose explained the number of inconsistencies that have characterized fifty years of crystallographic studies of cellulose. Thus the eight-chain unit cell can be explained as an artifact arising from the superposition of the diffraction diagrams of the phases Iα and Iβ, which are both present in Valonia cellulose.
The occurrence of this dimorphism in native cellulose has been confirmed by systematic investigations by X-ray and neutron diffraction of a wide range of samples. The dimorphic concept has also permitted elucidation of several features of the spectra reported in infrared
and Raman spectroscopic studies . In subsequent X-ray and electron-diffraction studies, the space group and the chain packing of the Iα and Iβ phases have been further characterized , . Cellulose Iα has a triclinic unit cell containing one chain, whereas cellulose Iβ has a monoclinic unit cell containing two parallel chains, similar to the approximate unit cell proposed previously for cellulose I . The "parallel-up" chain-packing organization favored by Sarko and Muggli has been confirmed by an electron microscopy study . These results have allowed a number of molecular descriptions for Iα and Iβ to be produced by molecular-modeling methodology , , , .
There has also been a re-examination of the cellulose Iβ structure as determined from X-ray patterns of Valonia cellulose .
The experimental revision of the structure of cellulose I, in light of this dimorphism, awaited the development of new structural tools, such as those provided by synchrotron and neutron techniques. To achieve this, methods have been developed for deuteration of the intra-crystalline regions of native cellulose without affecting the overall structural integrity , .
The neutron-diffraction diagrams obtained in these studies are presented for cellulose I and for cellulose II. These fiber-diffraction diagrams are recorded at a resolution of 0.9 Å; and several hundred independent diffraction spots can be measured, opening the road for the establishment of unambiguous three-dimensional structures.
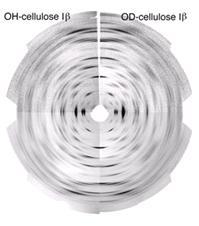
Fig. 10 Neutron diffraction pattern recorded on a normal (OH, left) and on a deuterated (OD) sample of cellulose I β
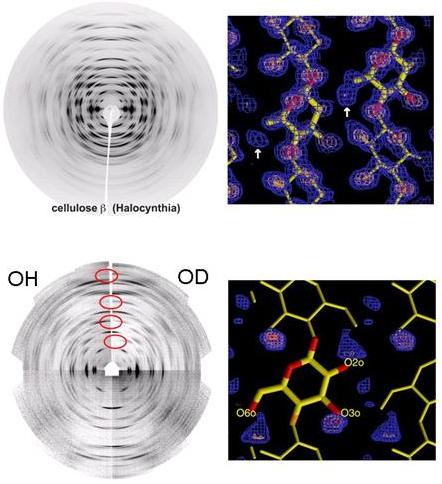
Fig. 11 X-Ray-and neutron fiber-diffraction patterns recorded from native cellulose (OH) and fully deuterated (OD) cellulose samples. The difference in the scattering properties of hydrogen and deuterium (indicated by the red circles) allows the precise location of the electron density (shown in blue), which corresponds to the position of hydrogen atoms in the crystalline lattice.
The deuterated fibers give high-resolution neutron-diffraction patterns with intensities that are substantially different from the intensities observed on neutron-diffraction patterns obtained from hydrogenated fibers.
The crystal structure and hydrogen-bonding system in cellulose Iβ was elucidated by the combined use of synchrotron X-ray and neutron fiber diffraction .
Oriented fibrous samples were prepared by aligning cellulose microcrystals from tunicin, reconstituted into oriented films. These samples diffracted both synchrotron X-rays and neutrons to a resolution better than 1 Å, yielding more than 300 unique reflections and an unambiguous assignment of the monoclinic unit-cell dimensions, (a = 7.784 Å, b = 8.201 Å, c = 10.380 Å, γ = 96.5º) in the space group P21. The X-ray data were used to determine the positions of the carbon and oxygen atoms. The positions of hydrogen atoms involved in hydrogen bonding were determined from Fourier-difference analysis, using neutron-diffraction data collected from hydrogenated and deuterated samples.
The chains are located on the 21 axes of the monoclinic cell, therefore they are not linked by any symmetry operation. The resulting structure consists of two parallel chains having slightly different conformations, both in terms of backbone and glucose conformations. All of the hydroxymethyl groups adopt the trans–gauche orientation, which allows the formation of intrachain hydrogen bonds involving O-2 and O-6 groups interacting throughout multiple possibilities. In contrast, the O-3....O-5 intramolecular hydrogen bond is well localized and unambiguous. Such a multiple hydrogen-bonding scheme explains the complex O–C stretching bands observed in the infrared spectra of cellulose Iβ. The cellulose chains are organized in sheets packed in a "parallel-up" fashion. There are no intersheet O-H...O hydrogen bonds in cellulose Iβ, and therefore, the cellulose sheets are held together only by hydrophobic interactions and weak C-H...O bonds.
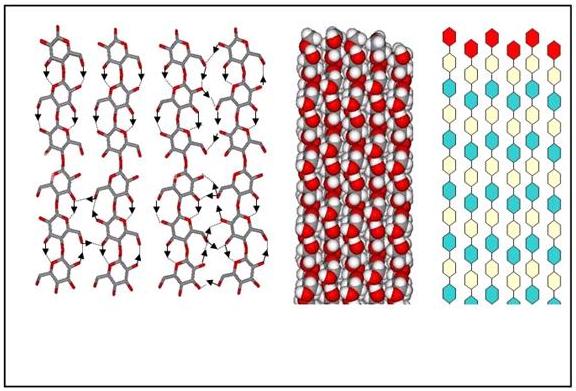
Fig. 12 Structural details of cellulose Iβ
The occurrence of nonequivalent chains may explain the fine details displayed by the 13C CP-MAS sepctra of cellulose Iβ .
The resonances assigned to the C-1, C-4, and C-6 atoms exhibit distinct splitting. The different conformations of the glycosidic linkages and at the primary hydroxyl groups for the nonequivalent chains provide a structural explanation for these splittings.
The crystal and molecular structures of the cellulose Iα allomorph have been established using synchrotron- and neutron-diffraction data recorded from oriented fibrous samples prepared by aligning cellulose microcrystals from the cell wall of the fresh water alga Glaucocystis nostochinearum .
The X-ray data recorded at 1 Å resolution were used to determine positions of the C and O atoms. The positions of hydrogen atoms involved in hydrogen bonding were determined from a Fourier difference analysis, using neutron-diffraction data collected from hydrogenated and deuterated samples. The resulting structure is a one-chain triclinic unit-cell of dimensions: a = 6.717 Å, b = 5.962 Å, c = 10.400 Å, α = 118.08°, β = 114.80°, γ= 80.37°, space group P1. The structure consists of a parallel chain arrangement of the “parallel-up” type packed in very efficient way, the density being 1.61 (Fig. 13). Contiguous residues along the chain axis adopt a conformation remarkably close to a 2-fold screw, which is not required by the space-group symmetry; all of the hydroxymethyl groups being in a trans–gauche conformation. The occurrence of the intrachain hydrogen bond O-3…O-5 is found throughout the structure, with an alternation of two slightly different geometries. The hydrogen bonds associated with O-2 and O-6 are distributed between a number of partially occupied, but still well-defined positions. As with cellulose Iβ, these partially occupied positions can be described by two mutually exclusive hydrogen-bonding networks, and there is no hint of intersheet O-H…O hydrogen bonds.
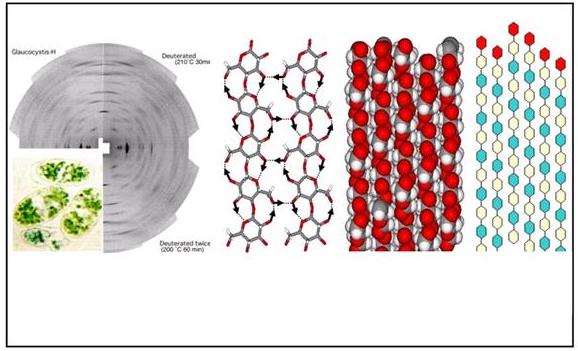
Fig. 13 Structural details of cellulose Iα
Given the relationship between monoclinic and triclinic unit cells, as well as the Iα→Iβ transformation effected by annealing in the solid state, it is likely that cellulose Iα also packs in a "parallel-up" fashion. The projections of the crystal structures of cellulose Iα and Iβ down the chain axis are remarkably similar (see later Fig. 17). As is shown by the projection perpendicular to the chain axis in the plane of the hydrogen-bonded sheets, the main difference is the relative displacement of the sheets in the chain direction. In both Iα and Iβ, there is a relative shift of about c/4 in the “up’ direction between neighboring sheets. The most probable route for the solid-state conversion of cellulose Iα to I^β is the relative slippage of the cellulose chains past one another. Such a movement does not require the disruption of the hydrogen-bonded sheets (along the 010 planes for cellulose Iβ and 110 planes for cellulose Iα), but slippage by c/2 at the interface of the sheets. The exact location of the Iα and Iβ phases along the crystalline cellulose microfibrils is another subject of interest. The respective components could be identified as alternating along the microfibril of the highly crystalline algal cellulose in the cell wall of Microdiction .
Modeling studies have established that the two crystalline arrangements correspond to the two low-energy structures which could arise from parallel associations of cellulose chains. Within the framework of these studies, three-dimensional models have also been proposed which allow comparison of the similarities and the differences that characterize the two allomorphs of native cellulose .
Several hypotheses have been proposed to account for the occurrence of two phases in native cellulose. In general, samples that are rich in Iα are biosynthesized by linear terminal complexes containing a number of cellulose synthases, assembled in biological spinnerets at the cell membranes. Those rich in Iβ are organized in a rosette fashion .
However, a notable exception is tunicin, where linear terminal complexes produce almost pure Iβ .
Obviously, a comparison between the morphology of Iβ tunicin microfibrils with those of Iα-rich seaweed would be instructive. The former have a parallelogram shape, whereas the latter have a shape that is square (Fig. 14). Therefore, despite their common linear geometry, the terminal complexes of tunicates and those of seaweeds produce microfibrils of different shapes and crystalline polymorphism. Other factors may play a key role inducing crystalline structures of cellulose.
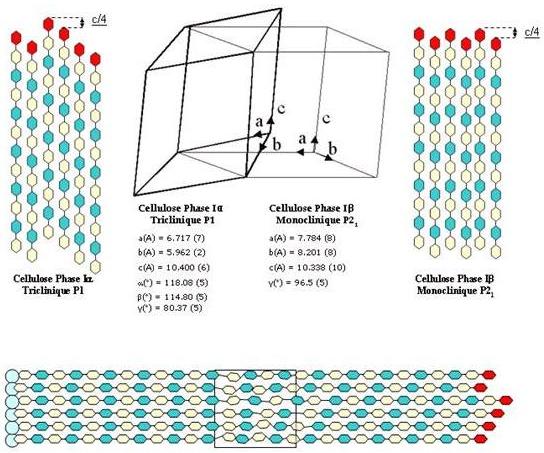
Fig. 14 The relationships between the unit cell of cellulose Ia and Ib, and a schematic representation of the simultaneous occurrence of the two allomorphs within the same microfibril. Such an event (boxed area) is likely to be the site of an amorphous moiety within the microfibril
4. Cellulose II
Early work on the solid-state structure of cellulose dates from 1929 when it was proposed that the unit cell has dimensions: a = 8.14 Å, b = 14 Å, c = 10.3 Å, γ = 62,º and contained two cellulose chains. This proposal has generated little controversy, despite the difficulty in precisely indexing the X-ray diffraction reflections. However, a larger unit cell (a = 15.92 Å, b =18.22 Å, c = 18.22 Å, γ =117º) was proposed on the basis of a neutron-diffraction study, which called into question the previous assignment of the monoclinic space group P21 .
These variations could arise from the use of neutron diffraction, which is sensitive to structural defects and disorder arising from various factors affecting the orientation of the hydrogen atoms in the hydroxyl groups. Furthermore, it could be argued that the methods of preparation of this allomorph might account for some of the differences. There are indeed two main routes to cellulose II: mercerization, which involves treatment with alkali and solubilization, followed by regeneration (recrystallization). In spite of the similarities in unit cell dimensions, there are some differences that seem to be significant. For example, the value of the a dimension in a cellulose regenerated from ramie is 8.662 Å, but is 8.588 Å in cellulose obtained by mercerization. Similarly, the value of the angle g is always more significant for mercerized celluloses than for regenerated celluloses. It also seems probable that the sample purity has a bearing on the quality of the crystalline domains and unit cell parameters leading, as in the case of regeneration, to elevated rates of conversion .
There are few reports of the occurrence of the type II allomorph in native celluloses .
However, a structure corresponding to cellulose II has been proposed for cellulose from a mutant strain of Acetobacter xylinum .
Several structural determinations have used a combined approach of X-ray diffraction data and modeling methods for minimizing the packing energies of cellulose chains in the unit cell , , .
In spite of some minor differences, the results agree sufficiently well to propose a model in which the cellulose chains have almost perfect two-fold symmetry and is compatible with the occurrence of two intermolecular hydrogen-bonds between consecutive residues (OH-3'...O-5 [2.70 Å] and OH-2...O-6' [2.70 Å]. Within the crystalline mesh, a network of hydrogen bonds ensures the formation of layers composed of cellulose chains. A notable feature of this three-dimensional arrangement is the antiparallel orientation of the cellulose chains.
The similarities that exist between X-ray powder-diffraction diagrams of cellulosic oligomers and that of cellulose II has excited the curiosity of crystallographers, since it seemed likely that high-quality structural data from single crystals could be used to construct a model for the polymer. However, in spite of early success in crystallizing cellotetraose and attempts at simulation, it was not until 1995 that the structure was resolved by two independent research groups .
Cellotetraose crystallizes in a triclinic unit cell (a = 8.023 Å, b = 8.951 Å, c = 22.445 Å, α = 89.26°, β = 85.07°, γ = 63.93º) having space group P1 containing two independent molecules. A major conclusion of these studies concerned the significant differences in the geometry of the two cellotetraose molecules, which are oriented in antiparallel fashion in the unit cell. Application of these new data to the resolution of cellulose II , has, in the main, confirmed the conclusions of these studies with regard to the relative chain orientation, the network of hydrogen bonds, the chain conformation, and unambiguous assignment of the gauche-trans conformation of the primary hydroxyl groups, all in accord with spectroscopic data.
Progress with methods of intracrystalline deuteration
have also made an important contribution to elucidation of the cellulose II structure. Indeed, the combination of X-ray and neutron-diffraction data has allowed precise analysis of the complex network of inter- and intra-molecular hydrogen bonding in cellulose II obtained by regeneration. This is the best model available for cellulose II (Fig. 15). In this model, the structure of cellulose II is based on a two-chain unit cell of dimensions cell (a = 8.10 Å, b = 9.04 Å, c = 10.36 Å, γ = 117.1º). The chains are located on the 21 axes of the monoclinic cell and they are antiparallel. The two chains have different backbone and glucose conformations. The glucose residues of the central chain are strained, and the chains are displaced relative to each other by about ¼ of the fiber repeat. The hydroxymethyl groups of the central chains are disordered, and occupy both trans–gauche and gauche–trans positions. The precise location of hydrogen atoms provides a detailed description of the hydrogen-bonding system. A systematic three-center intrachain hydrogen-bond pattern is observed in both chains. This bond has a major component between O-3 and O-5, with O-3 as a donor. A similar three-center hydrogen-bond interaction occurs in the b-cellotetraose structure. The intermolecular hydrogen bonding differs substantially from that observed in b-cellotetraose. One consequence of the difference is that O-6 of the origin chain can donate a hydrogen bond to three possible acceptors, the major component being to O-6 of the center chain. These three-acceptors already interact with each other through a three-center hydrogen bond. It is not clear to what extend disorder of the O-6 group of the centre chain is responsible for this intricate hydrogen-bonding arrangement.
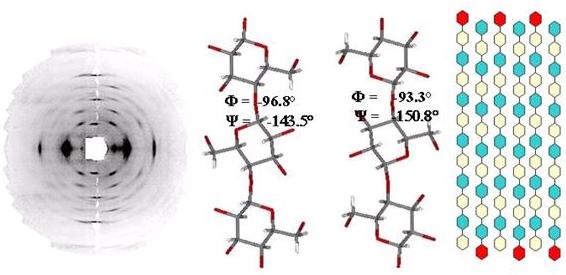
Fig. 15 Structural details of Cellulose II
The use synchrotron X-ray data collected from ramie fibers after ad hoc treatment in NaOH provided a revised crystal-structure determination of mercerized cellulose II at 1 Å resolution .
The unit-cell dimensions of the P21 monoclinic space group are a = 8.10 Å, b = 9.04 Å, c = 10.36 Å, γ = 117.1.° As with the regenerated cellulose, the chains are located on the 21 axes of the cell. This indicates that the different ways of preparing cellulose II result in similar crystal and molecular structures. The crystal structure consists of anti-parallel chains having different conformations, but with the hydroxymethyl groups of both chains near the gauche–trans orientation. There are nevertheless some significant differences between the conformations of the hydroxymethyl group of the center chain as compared to that found in regenerated cellulose. This may be related to the difference observed in the amount of hydroxymethyl group disorder; 30% for regenerated cellulose and 10% for mercerized cellulose. Whether this disorder is confined to the surface of the crystallites or is pervasive is not yet known.
5. Cellulose III
The crystalline forms of cellulose III (III1 and III2) are reversible; they can be prepared by the same treatment in dry liquid ammonia, starting from native or regenerated cellulose. This suggests that, as with allomorphs I and II, the chain orientation is the same as in the starting material , .
From unit cell dimensions a = 10.25 Å, b = 7.78 Å, c = 10.34 Å, γ = 122.4° a structural model in which the chains did not have strict two-fold symmetry was proposed. Several research investigations have focused on the reversible transformations between cellulose I and cellulose III, using such techniques as electron microscopy, solid-state NMR, , ,
X-ray diffraction and molecular modeling From one study of the cellulose I→II transformation involving an intermediate cellulose I–EDA complex, it was concluded that a liquid-crystalline phase was involved .
In Valonia cellulose, the conversion from form I to II was accompanied by an important de-crystallization and fragmentation of the cellulose crystal. This reverse transition resulted in partial re-crystallization, but it did not allow complete restoration of the damage done to the morphological surface. Characterization by electron diffraction revealed that the uniplanar–uniaxial orientation of the crystalline cellulose microfibrils was lost completely during the stage of swelling and washing necessary for the conversion into cellulose III1. Washing with methanol resulted in the formation of irregularities into which were inserted crystalline domains of small dimensions. The final material that crystallized in the cellulose I form was obtained by treatment with hot water, and characteristically displayed an increase in the accessible surface and consequently reactivity.
Solid-state NMR studies have shown a significant decrease in the lateral crystallite dimensions during the cellulose I→III1 transition. At the same time, the cellulose chains show conformational changes arising from the primary hydroxyl groups, which change from a trans–gauche arrangement in cellulose I (65.7 ppm) to gauche–trans in the cellulose I–EDA (62.2 ppm) in the allomorph III1. Thus the regenerated cellulose I provides a spectrum that differs from that of the native form. Electron microscopy shows that cellulose I complexed with EDA is composed of non-uniform crystalline domains, whereas the III1 allomorph is characterized by well-defined crystalline zones. The conformational changes observed for the primary hydroxyl groups are of interest, as they provide possible markers for study of the various conformational transitions associated with cellulosic systems.
Whereas the molecular and crystal structure of cellulose III2 has not yet been solved, that of cellulose III1 was established from synchrotron and neutron fiber diffraction .
It consists of a one-chain unit cell in a monoclinic P21 space group, which implies a parallel arrangement of the cellulose chains. The chain conformation resembles the center chain of the cellulose II structure, as established previously .
The primary hydroxyl groups are in the gauche–trans conformation, and there is one bifurcated hydrogen bond: O-3… O-5 and O-3…O-6.
6. Cellulose IV
Heating cellulose III in glycerol for 20 min at 260 °C yields cellulose IV and the two allomorphs, IV1 and IV2 , originate from cellulose I and II, respectively. The conversions are never totally complete, which explains the difficulties in the production of good quality X-ray diffraction patterns .
However, unit cell dimensions have been obtained for the two allomorphs of which IV1 has a = 8.03 Å, b = 8.13 Å, c = 10.34 Å, which is close to those found for form IV2 a = 7.99 Å, b = 8.10 Å, c = 10.34 Å .
In both instances the poor quality of the diffraction patterns does not allow determination of the space group. The authors suggest space group P1, but this is not compatible with the proposed unit cell dimensions.
7. Alkali Cellulose and Other Solvent Complexes
Existing research reports have tended to focus on the relative arrangement of cellulose chains in the cellulose I and II allomorphs. Whereas in native architectures the chains are parallel, regenerated or mercerized celluloses have antiparallel arrangements. Elucidation of the detailed events taking place during the transformation of cellulose I and II is of great interest, especially as the process of mercerization does not appear to require solubilization of the cellulose chains. It would seem, therefore, that the cellulose structure should be preserved. To understand the mechanisms that come into play, a great number of investigations have been dedicated to the study of intermediate structures , .
By X-ray diffraction characterization, Okano and Sarko put forward evidence for the occurrence of five different types of structure that could be classified as a function of the cellulose-chain conformation. Soda celluloses of type I, III, and IV were characterized by a repeat of 10.3 Å, whereas types IIA and IIB had a repeat of 15.0 Å, corresponding to a helicoidal repeat of 3, a value not seen in previous studies, but in agreement with the prediction from molecular modeling studies. In addition, all of the “soda celluloses” showed a reasonable degree of crystallinity and orientation. It thus seems difficult to reconcile a change of orientation with the mercerization process. These workers proposed that, since soda cellulose I could not be converted back into cellulose I, the chains must be arranged in anti-parallel fashion, namely as in cellulose II. Despite the failure to identify the mechanisms coming into play during the transformation from a parallel arrangement (cellulose I) to an antiparallel arrangement (cellulose II), these reports nevertheless have the merit of identifying the intermediate stage (Na-cellulose), from which the structural rearrangement could arise without chain solubilization.
An extension of this research can be found in the studies of Hayashi et al. in which nine types of Na-cellulose (which could be formed from allomorphs I, II, III, and IV) were identified , .
From these studies, it was concluded that the irreversibility probably depended more on conformational changes of the cellulose chain than chain rearrangements. This argument seems unconvincing, since the energy differences between two-fold and three-fold helices are too small to account for the irreversibility observed for type I and II structures. Another tentative explanation was made from the occurrence of two types of microfibril in samples of Valonia cellulose, one of which had the chains oriented along the Oz crystal axis, the other having chains oriented in the opposite sense .
Most of the investigations dealing with mercerization of cellulose have focused on global measurements recorded on whole fibers, namely an assembly of large number of organized microfibrils. The structural and morphological changes accompanying mercerization of isolated cellulose microfibrils have been monitored by transmission electron microscopy, X-ray, FTIR, and 13C CP-MAS NMR. The changes in morphology when going to cellulose I to cellulose II were spectacular, as all the microfibrillar morphology disappeared during the treatment. The conclusion of this investigation is that is impossible for isolated cellulose microfibrils to become mercerized while maintaining their initial morphology .
A few crystal structures with solvent molecules incorporated within the crystal lattice have been investigated: cellulose II–hydrazine complex cellulose II–hydrate and the cellulose–ethylenediamine complexes .
A large number of cellulose complexes have been characterized by X-ray diffractograms.
8. Cellulose Acetate and Cellulose Derivatives
Acetylation of all hydroxyl groups of the cellulose chain yields cellulose triacetate (abbreviated as CTA); it is soluble in chloroform but insoluble in acetone. The cellulose acetate most commonly used in industrial processes is obtained by a partial deacetylation of CTA to degree of substitution of about 2.6, and this product is soluble in acetone. As early as 1929, Hess and Trogus identified two types of crystalline structures, namely CTA I and CTA II. CTA I is obtained by heterogenous acetylation of native cellulose without ever dissolving the starting material. In contrast, CTA II can be obtained either by homogeneous acetylation, the cellulose acetate being completely dissolved, or by a heterogenous reaction of cellulose II. The two polymorphs return to their original polymorph, cellulose I and cellulose II, upon saponification .
The first attempt to establish the crystal and molecular structure of CTA I was made by Stipanovic and Sarko who suggested the occurrence of parallel-arranged cellulosic chains within an orthorhombic unit cell. Later, the structural analysis of the diffraction pattern from an acetylated material derived from the green alga Cladophora sp., established it as a one-chain unit cell crystallizing in the P21 space group ( a= 5.94, b=11.43, c=10.46(A), γ = 95.4°, density = 1.375).
The first structural model for CTA II was proposed by Dulmage in 1957 and it was not until 1978 that a reliable structure was obtained, from a single-crystal structure elucidation by electron diffraction .
An orthorhombic unit cell having dimensions of a = 24.68, b = 11.52, c = 10.54 (A), density = 1.29, space group P212121 indicated an anti-parallel arrangement of the chains. (Fig. 16). Successive attempts to refine further this crystal structure have not yet modified significantly the structural features established through electron crystallography.
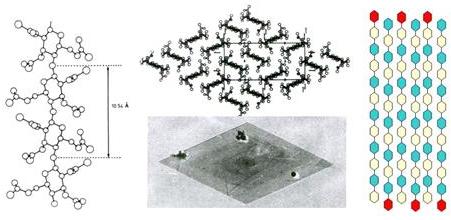
Fig. 16 Cellulose triacetate (CTA) II: (a) Transmission electron microscopy of a polymeric single crystal of CTA II; (b) projections of the chains I the a-b plane; (c) Electron diffraction pattern of a tip of a single crystal of CTA II in the a-b plane
IV. Morphologies of Celluloses
Much research has been devoted to experimental and theoretical studies of the crystalline component of native cellulose, often in a context in which knowledge of the molecular and crystallographic structure of native cellulose was lacking.
The microfibrillar structure of cellulose has been established beyond doubt through the application of electron microscopy , and great variations in dimensions, depending on origin of the sample, have been reported , , .
The question of whether or not intermediate structural components termed elementary fibrils exist has been a topic of great controversy. However, the application of transmission electron microscopy , has established with certainty that the microfibril is the basic crystalline component of native cellulose , , , .
It appears that the different levels of structural organization of cellulose are now well characterized.
1. Polarity of Cellulose Crystals
The cellulose chain possesses a “polarity” that arises from the chemical difference of the two ends of the molecule, and this confers particularly interesting properties to the crystalline architecture. In effect, two types of arrangement can be envisaged depending on whether the reducing groups are all located at the same end of the chain assembly (parallel arrangement) or whether the reducing and non-reducing ends are arranged in alternating fashion within the assembly (antiparallel arrangement). The answer to this question has been the aim of numerous investigations, but has equally given rise to a number of controversies. In their original model, Meyer and Misch had proposed an antiparallel arrangement which was supported by the observations of Colvin on the production of bacterial cellulose
in which the reducing ends of cellulose had been stained with silver nitrate .
However, other attempts to identify reducing-chain ends using conditions similar to those of Colvin were interpreted as supporting a parallel chain arrangement. The use of exocellulases provided final experimental proof of the parallel arrangement , , in the family of native celluloses .
Investigations using complementary enzymatic and chemical staining of reducing ends supported this model and, at the same time, produced precise descriptions of the orientation of the chains relative to the crystal axes ,.
Hence, the crystalline microfibrils possess the same polarity as the chains of which they are composed. These conclusions are in agreement with the body of crystallographic and molecular modeling studies and reflect the constraints imposed by the biosynthetic requirements of native cellulose.
2. Crystalline Morphology of Native Celluloses
The availability of an accurate description of the crystalline structure of cellulose Ib, along with the predicted features of cellulose Ia, provide new insights into the crystalline morphology of native celluloses. These models can be used to generate different ordered atomic surfaces, and evaluate their occurrence along with their respective features. The schematic representation of the crystalline arrangements of cellulose Iα and Iβ in relation to their respective unit cells is shown in Fig. 18. Irrespective of the fine structural differences, the same gross features are exhibited by the two polymorphs, indicating that the same morphological features are expected to occur in the native celluloses. From such structural arrangements, distinct types of crystalline surfaces can be readily identified.
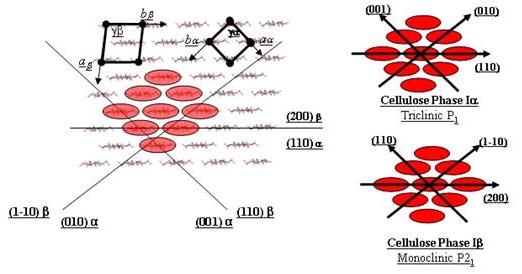
Fig. 17 Schematic representation of the crystalline arrangement of cellulose Iα and Iβ in relation with their unit cells. The triclinic and monoclinic unit cells are shown, along with the main crystallographic directions relevant for the crystalline morphologies
The type 1 surface represents the faces that run through the diagonal of the of the ab plane of the Iβ monoclinic unit cell, or through the a and b axis of the Iα triclinic unit cell. These surfaces are tortuous, displaying grooves extending parallel to the c axis. They are created by free spaces between the chains. Hydroxyl groups point outward, emphasizing the hydrophilic character of these surfaces. The type 2 surface represents the faces that run through either the b axis of the Iβ crystal, or the first diagonal of the ab plane of the Iα crystals. The cellulosic chains display C-H groups at the surface, and this surface is flat and hydrophobic. The type 3 surface represents the faces that are parallel to the a axis of the Iβ unit cell, or to the second diagonal of the ab plane of the Iα crystals (Fig. 18).
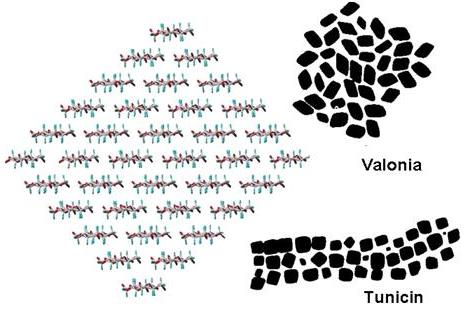
Fig. 18 Molecular model of a microfibril of cellulose, projected along the fibril axes compared with the typical morphologies observed for Valonia cellulose and tunicin, along with the CPK representation of the main crystalline faces for cellulose I
3. Whiskers and Cellulose Microfibrils
Depending on their origin cellulose microfibrils have diameters from 20 – 200 Å, while their lengths can attain several tens of microns .
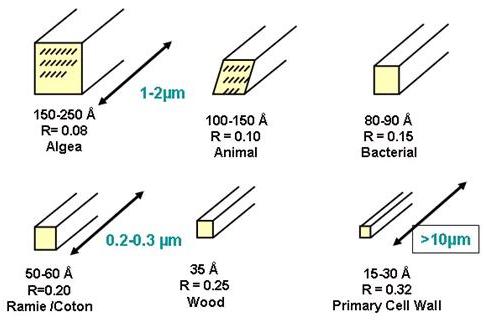
Fig. 19 Range of micrifibril sizes for different sources of cellulose; R is the ratio of the number of surface chains over the total number of cellulose chains. The estimated number of cellulose chains in one crystalline microfibril according to the origin of cellulose: Valonia: 1200; Micrasterias: 900; Tunicin: 800; Cotton: 80; Wood: 35; Parenchyma: 20
These characteristics confer very interesting mechanical properties on microfibrils. Transmission electron-diffraction methods have made a contribution to the quantification of the degree of crystallinity. Thus, using the technique of “image reconstruction” it was shown that, in the microfibril of Valonia cellulose, which has a diameter of about 200 Å, there could be more than 1000 cellulose chains, all aligned parallel in an almost perfect crystalline array.
Some imperfections arise from dislocations at the interface of microcrystalline domains along the microfibril length , .
These imperfections were exploited to advantage by treatment of the sample with acid to produce nano-crystals called “whiskers,” having the same diameter as the starting microfibrils but of much shorter length.
These cellulose whiskers (Fig. 20) possess a mechanical modulus of about 130 GPa, which is close to that calculated for cellulose .
These characteristics (microscopic dimensions, form, and exceptional mechanical properties) made “whiskers” a choice ingredient in the manufacture of nano-composite materials .
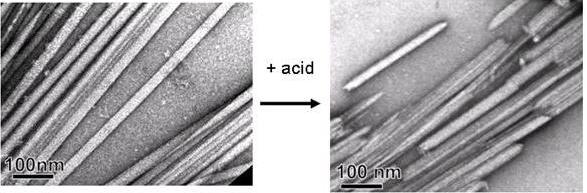
Fig. 20 Whiskers of celluloses (acid: HCl, H2SO4, HClO4)
Celluloses of different origin yield whiskers of diverse structural quality and suitable for a range of applications. Hydrolysis of bleached tunicin cellulose (from Halocynthia roretzi) with sulfuric acid yields monolithic nano-crystals of smooth appearance and lengths varying from hundreds of nanometers to several micrometers. The lateral dimensions of these monocrystals range from 50 to more than 200 Å, The nano-crystals obtained by hydrolysis of cotton linters are shorter than those from tunicin, and reach lengths of 0.1 micron, widths from 10–50 Å, and have an aspect ratio of 20. At the other end of the spectrum there are cellulose microfibrils from parenchyma that are quite different in appearance from those of cotton and tunicin. These microfibrils are produced by a mechanical treatment which, in contrast to hydrolysis, effects disruption of the microfibrils without affecting their original length. As a result, microfibrils several microns long and 20–30 Å wide are obtained.
Analysis of these different specimens by X-ray diffraction allows appreciation of the crystalline variation and the extent to which the amorphous components are present.
An idealized representation of the organization of cellulose chains is depicted in Fig. 21. It displays morphology and dimensions typical of those of microfibrils made up of 36 cellulose chains. In such a case, the total number of cellulose chains would be 36, and among them 20 could be considered as surface chains. This finding has been corroborated by CP-MAS NMR studies on ultrathin cellulose microfibrils extracted from sugar-beet pulp .
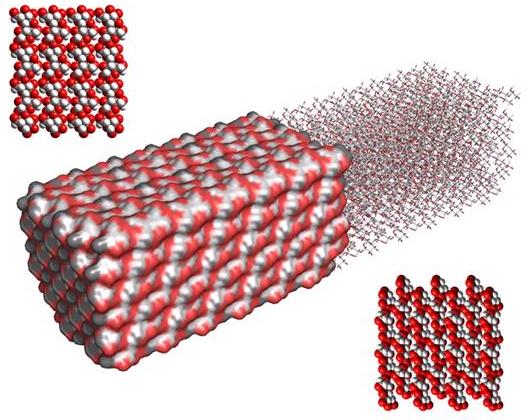
Fig. 21 Computer representation of the crystalline morphology and surfaces of a microfibril of cellulose made up of 36 cellulose chains
It may be estimated that the surface chains in tunicin microfibrils constitute no more than 5% of the total number of tunicin chains, whereas surface chains may constitute 70% of the total number in parenchyma microfibrils .
The result of increasing number of surface chains and decrease in whisker diameter can also evidenced by infrared spectroscopy, with a broadening of the absorption bands and loss of resolution. A peak at 1635 cm-1 may be attributed to vibrations arising from water molecules absorbed in the non-crystalline regions of cellulose .