A Database of Polysachharide 3D structures

| Home | |||||||
| About | |||||||
| User Guide | |||||||
| > Cellulose II for EXPERTS | |||||||
| Methods | |||||||
| References | |||||||
| Wiki | |||||||
| Contact us | |||||||
|
|
|||||||
Polysaccharides For Experts |
Cellulose II.........................................................................................
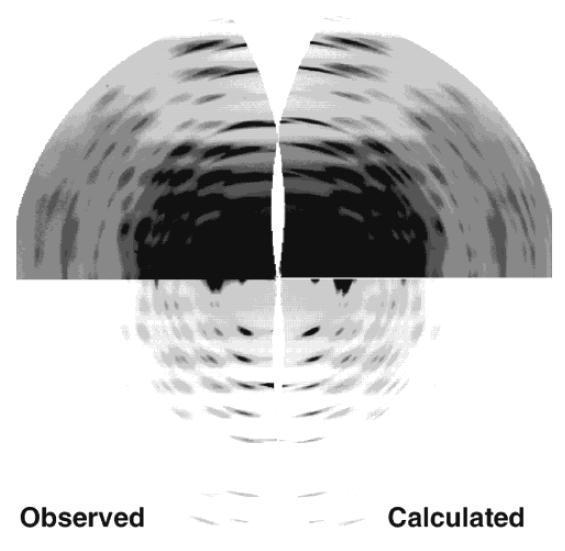
Fig.1 LEFT-HAND SIDE : Synchrotron X-ray diffraction data collected on an online MAR image plate from mercerized ramie fibers on station ID13 at the ESRF, Grenoble, France. RIGHT-HAND SIDE : A 2D fit of the background and Bragg intensities using program LSQINT, part of the BBSRC-funded CCP13 project, Daresbury, U.K. The images have been remapped into cylindrical reciprocal space with the fiber axis vertical and reproduced at low display thresholds (TOP) and high display thresholds (BOTTOM) so that the full dynamic range of reflections can be seen. *Permission Pending for Diffraction Diagrams
......................................................................................... Cellulose II Unit Cell Dimensions (a, b, c in Å and α, β, γ in °) (No values are displayed if no information is available or the value is zero) a (Å) = 8.10 - b (Å) = 9.03 - c (Å) = 10.31 - γ (°) = 117.10 - β (°) = 90.00 - α (°) = 90.00 Helix Type : antiparallel chains Method(s) Used For Structure Determination : X-ray diffraction Link to the Abstract : http://www.ncbi.nlm.nih.gov/pubmed/11749200
Download Structure
Unit cellulose-II-cornerchain_unit cellulose-II-2chains-together_expanded
|
