A Database of Polysachharide 3D structures

| Home | |||||||
| About | |||||||
| User Guide | |||||||
| > Exo-polysaccharide (Burkholderia cepacia) for EXPERTS | |||||||
| Methods | |||||||
| References | |||||||
| Wiki | |||||||
| Contact us | |||||||
|
|
|||||||
Polysaccharides For Experts |
Exo-polysaccharide (Burkholderia cepacia).........................................................................................
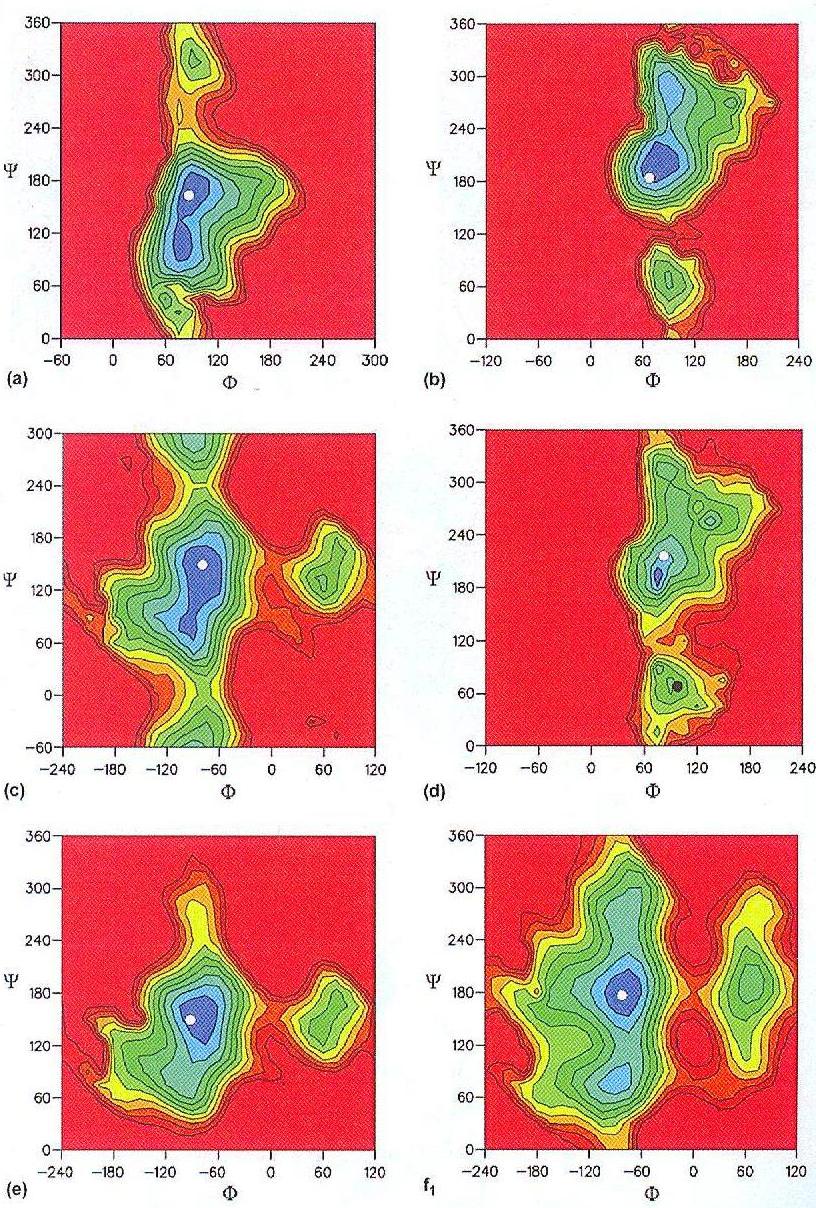
Fig.1 Adiabatic φ/ψ energy maps for the glycosidic linkages for the different disaccharide sub-structures of the repeating unit (plus one downstream residue) of B. cepacia. Contour levels are shown at every kcal/mol with blue for low-energy regions and red for high energy levels (a) The α-D-GlcpA-(1→3)-α-D-Manp linkage. (b) α-D-Galp-(1→2)-α-D-GlcpA. (c) β-D-GlcpA-(1→3)-α-D-GlcpA. (d) &alpha-D-Rhap-(1→4)-α-D-GlcpA. (e) β-D-Galp-(1→2)-α-D-Rhap. (f) β-D-GlcpA-(1→6)-α-D-Manp. f1 for φ/ψ, f2 for ω/ψ and f3 for φ/ω. (g) α-D-Manp-(1→3)-β-D-Glcp. The white dots show the torsion angle values of the global minimum for the repeat unit according to GLYGAL, the balck dots show the position of the major secondary minima of the repeating unit.
......................................................................................... Exo-polysaccharide (Burkholderia cepacia) Linkage : alpha 1-3, beta 1-3, beta 1-2 alpha 1-2, alpha 1-4, beta 1-6 Unit Cell Dimensions (a, b, c in Å and α, β, γ in °) (No values are displayed if no information is available or the value is zero) Method(s) Used For Structure Determination : - Link to the Abstract : http://www.ncbi.nlm.nih.gov/pubmed/15780266
Download Structure
Unit Burkholderia-cepacia_expanded
|
