![]()
A Database of Polysachharide 3D structures
| Home | |||||||
| About | |||||||
| User Guide | |||||||
| > Inulin (Hemihydrate) for EXPERTS | |||||||
| Methods | |||||||
| References | |||||||
| Wiki | |||||||
| Contact us | |||||||
|
|
|||||||
Polysaccharides For Experts |
Inulin (Hemihydrate).........................................................................................
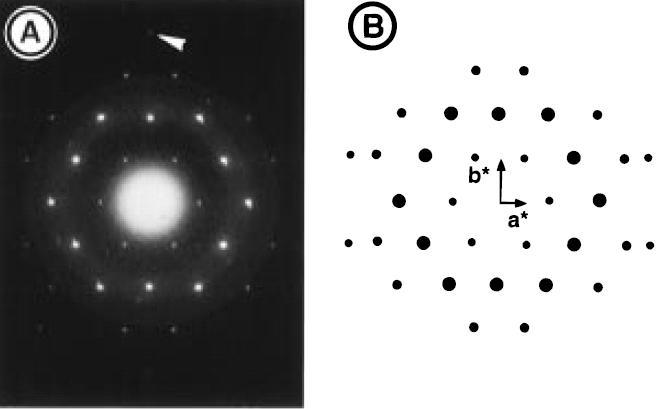
Fig.1 Comparison of the observed (A) and simulated (B) electron diffraction patterns for the base plane (hk0) of inulin hemihydrate. The arrow points toward the 040 reflection that is weak in the observed diffractogram but absent in the simulated pattern. *Permission Pending for Diffraction Diagrams
Fig.1 Comparison of the observed (A) and simulated (B) electron diffraction patterns for the base plane (hk0) of inulin hemihydrate. The arrow points toward the 040 reflection that is weak in the observed diffractogram but absent in the simulated pattern.
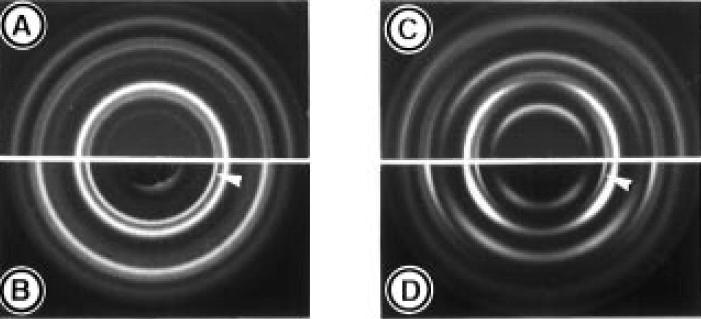
Fig.2 Comparison of the simulated (A and C) and observed (B and D) X-ray patterns of inulin hemihydrate. A and B correspond to powder patterns whereas C and D correspond to oriented patterns taken on crystal mats with the X-ray beam parallel to the mat surface. The arrows in B and D correspond to composite reflections 110 and 200 that are observed in inulin hemihydrate but are totally absent in inulin monohydrate. *Permission Pending for Diffraction Diagrams
......................................................................................... Inulin (Hemihydrate) Space Group : orthorhombic P212121 Unit Cell Dimensions (a, b, c in Å and α, β, γ in °) (No values are displayed if no information is available or the value is zero) a (Å) = 16.70 - b (Å) = 9.65 - c (Å) = 14.40 - γ (°) = 90.00 Link to the Abstract : http://pubs.acs.org/doi/abs/10.1021/ma951799f Molecular and Crystal Structures of Inulin from Electron Diffraction DataI. André, K. Mazeau, I. Tvaroska, J.-L. Putaux, W. T. Winter, F. R. Taravel, and, H. Chanzy, Macromolecules 1996, 29(13), 4626-4635
Download Structure
|