A Database of Polysachharide 3D structures

| Home | |||||||
| About | |||||||
| User Guide | |||||||
| > Mannan I (electron diffraction) for EXPERTS | |||||||
| Methods | |||||||
| References | |||||||
| Wiki | |||||||
| Contact us | |||||||
|
|
|||||||
Polysaccharides For Experts |
Mannan I (electron diffraction).........................................................................................
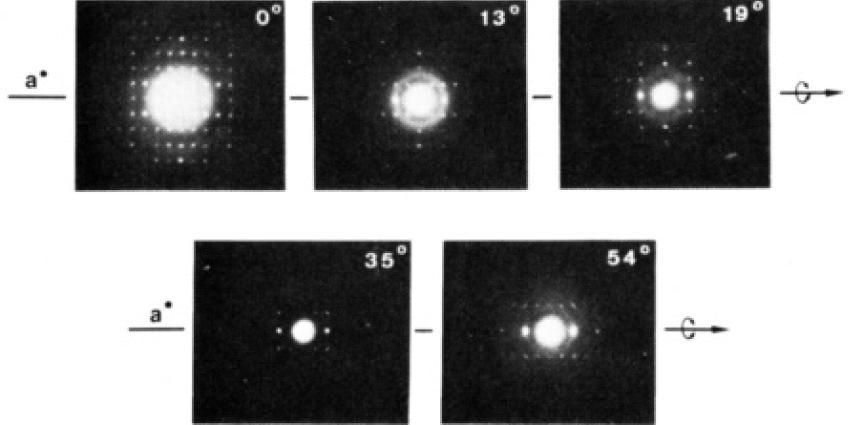
Fig.1 Electron diffraction patterns obtained from mannan I crystals rotated by ±13°, ±19°, ±35°, and ±54° around a*, in comparison with an untilted diagram (tilt 0°) . For each setting the same crystal was used for the positive and negative orientations and the resulting diagrams were identical in each case. Different crystals were used for each setting. *Permission Pending for Diffraction Diagrams
......................................................................................... Mannan I (electron diffraction) Space Group : orthorhombic P212121 Unit Cell Dimensions (a, b, c in Å and α, β, γ in °) (No values are displayed if no information is available or the value is zero) a (Å) = 8.92 - b (Å) = 7.21 - c (Å) = 10.27 Helix Type : highly extended 2-fold helices Method(s) Used For Structure Determination : electron diffraction and stereochemical restraints Link to the Abstract : http://pubs.acs.org/doi/abs/10.1021/ma00176a014
Download Structure
|
